Average Consumption
About
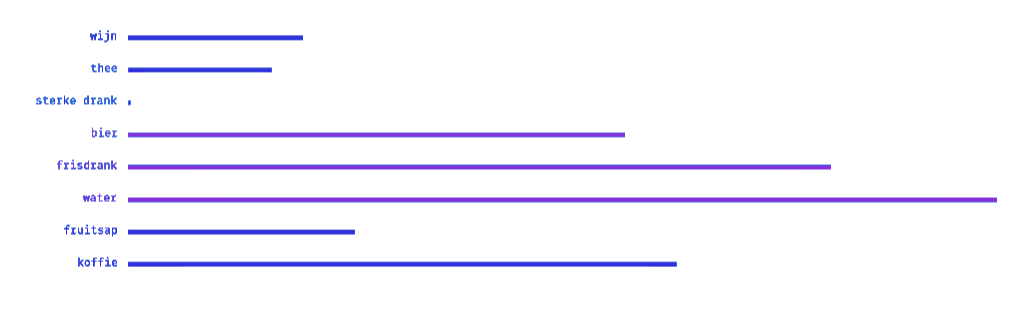
These 3 different visualizations show a representation of my drinking behavior of 2 weeks. Every image is created from the same data, but put in a different order. The repeated rectangles represent the duration and amount of each drink and the speed of consumption. By creating a mix node that connects each form, you can now see the animation linked in-between the visualizations.